Ingame resource tracking using grafana and prometheus
Not too long ago a new piece of content was added to RuneScape, a MMO I play. This suddenly made some ingame resources that so called workers would gather for you at a configurable speed (but a set limit) more important. As I tend to be quite forgetful about actually emptying these kinds of things I quickly set out to set up alerts for this. I could have gone with a very naive that would just fire after 7 days exactly or something like this, but that’s no fun. As I already run grafana, prometheus and pushgateway within my homelab anyway, I figured I could probably do something with that. The idea was simple. Have a simple bash script that I would run manually after using the resources ingame (which would only be about once a week anyway). And have the actual logic and alerts be handled by prometheus and grafana. So after a bit of tinkering I had the following script to push data towards pushgateway.
#!/bin/bash

# The actual script has every value repeated 6 times for every ingame resource, just keeping it briefly for the sake of example
stats() {
	when="$(date -u +'%s')"
	printf '# TYPE rs_anachronia_resources_when gauge\n'
	printf '# HELP rs_anachronia_resources_when timestamp of last recorded\n'
	printf 'rs_anachronia_resources_when{resource="wood"} %d\n' "$when" # Timestamp
	printf '# TYPE rs_anachronia_resources gauge\n'
	printf '# HELP rs_anachronia_resources amount of resources\n'
	printf 'rs_anachronia_resources{resource="wood"} %d\n' "0" # This is the base value
	printf '# TYPE rs_anachronia_resources_per_hour gauge\n'
	printf '# HELP rs_anachronia_resources_per_hour amount of resources we get per hour\n'
	printf 'rs_anachronia_resources_per_hour{resource="wood"} %d\n' "600" # Amount of resources per hour
}

stats | curl --data-binary @- http://<prometheus ip>:9091/metrics/job/runescape
Next step, turning this into an actual graph in grafana. After a bit more tinkering I had the following promql query:
rs_anachronia_resources + (round((time() - rs_anachronia_resources_when) / 600) * (rs_anachronia_resources_per_hour / 60 * 10))
To break it down, we start off with the base value rs_anachronia_resources.
After this we calculate the amount of time between now time() and from when this base value was rs_anachronia_resources_when.
Then divide by 600 as we want our graph to increase in steps of 10 minutes (which is about the same as the ingame resources).
This value we then multiply with the amount of resources we would get within 10 minutes.
I could very well have done rs_anachronia_resources_per_hour / 6 here.
But I personally prefer doing / 60 * 10 to have it more clear that I’m calculating from 60 minutes to 10 minutes.
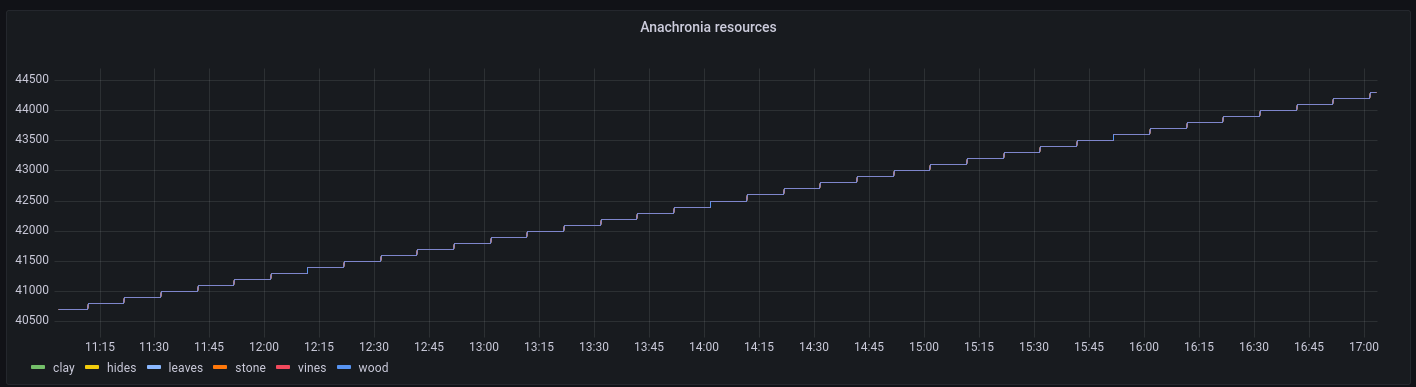
And pretty much right after having done this, I got the following graph.
Next step. Alerts.
I am aware that I could do this from prometheus as well, but I currently have all my alerts in Grafana.
So for the sake of staying consistent and having everything in one spot. Grafana it is.
This is actually fairly straight forward using the Grafana web interface, especially when directly clicking create alert from the panel setup page.
So I’m actually just going to leave a basic screenshot here.
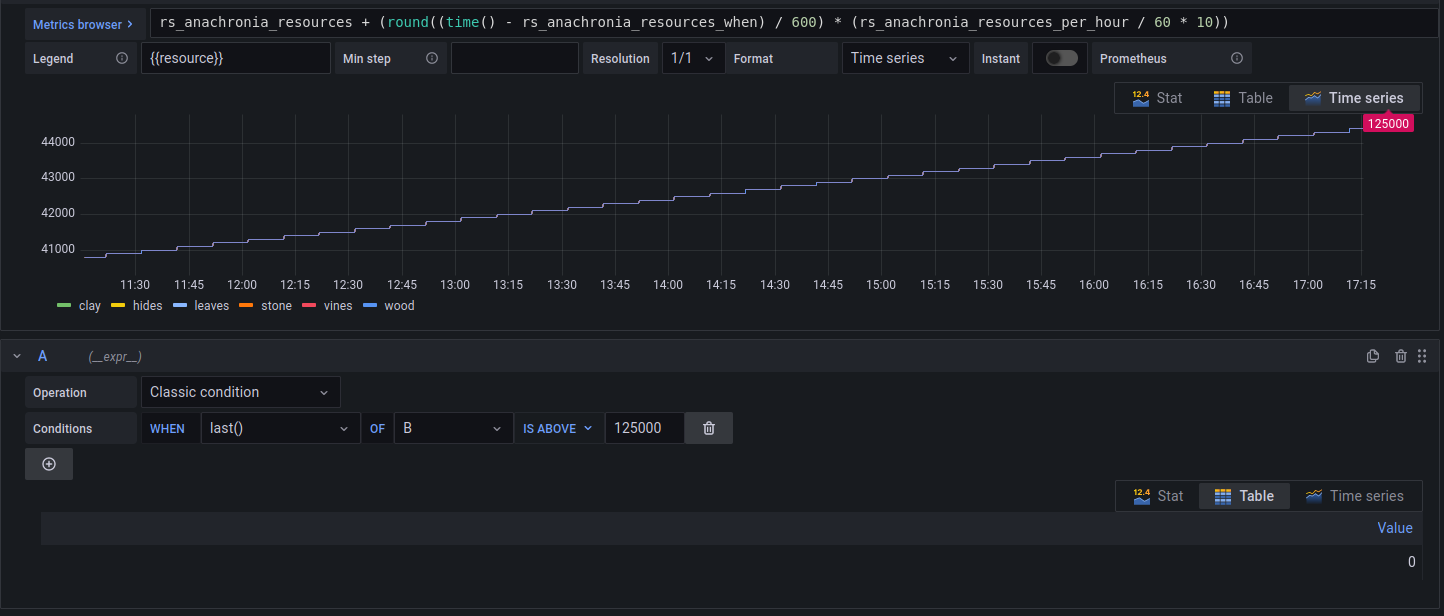 The only thing we really have to do here is setup the actual condition.
Which in this case is just a really basic, classic condition where it should trigger if a value is above a certain threshold (125.000 in the screenshot, actual limit ingame is 150.000 but I want an alert earlier).
The only thing we really have to do here is setup the actual condition.
Which in this case is just a really basic, classic condition where it should trigger if a value is above a certain threshold (125.000 in the screenshot, actual limit ingame is 150.000 but I want an alert earlier).
And that’s basically it.
Now all I have to do when using these ingame resources is run this bash script again so the graph resets back to 0.
And of course, if I ever decide to change the allocation of workers and would get more of a specific type of resource, I would have to adjust rs_anachronia_resources_per_hour in the script.
Again. I would not recommend using this approach to anyone, except if you already have grafana/prometheus running for something else.